
Interactive 3D Data and Simulation Visualizations with Plotly and MATLAB
Interactive 3D Data and Simulation Visualizations with Plotly and MATLAB
FEATool can be used to easily generate interactive surface, contour, arrow, and other visualizations of unstructured mesh and simulation data in 1D, 2D, and 3D. As FEATool also supports Plotly as rendering and visualization engine it is possible to create, interactively explore, and share simulation and unstructured …
Visualization and Postprocessing on Unstructured Grids and Meshes with FEATool Functions
Visualization and Postprocessing on Unstructured Grids and Meshes with FEATool Functions
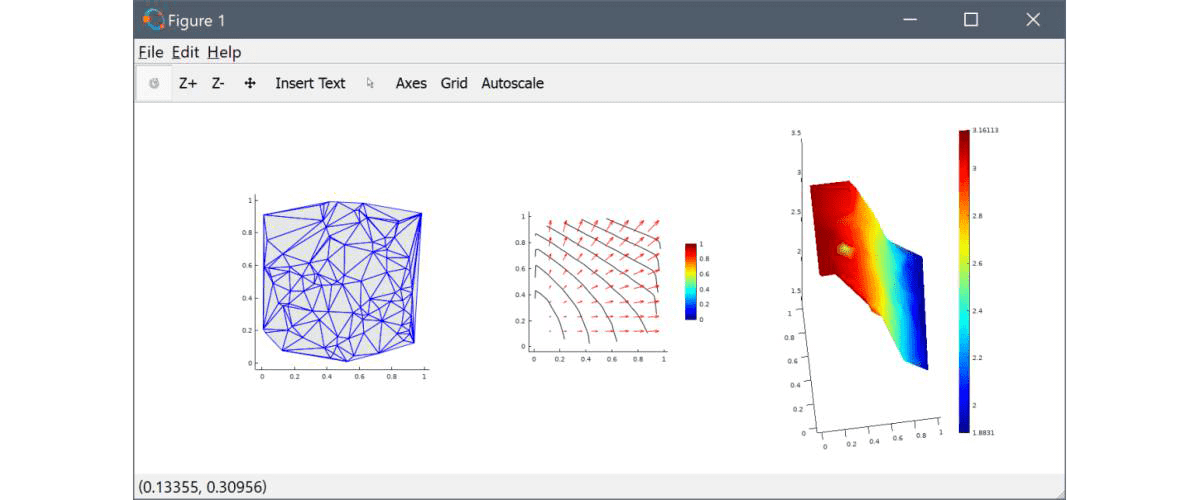
This post explains how to use MATLAB and the FEATool postprocessing function library to import, plot, and visualize general data on unstructured grids and meshes. Although MATLAB do include visualization functionality for surface and contour plots (with the surf and contour functions), it is currently limited to …
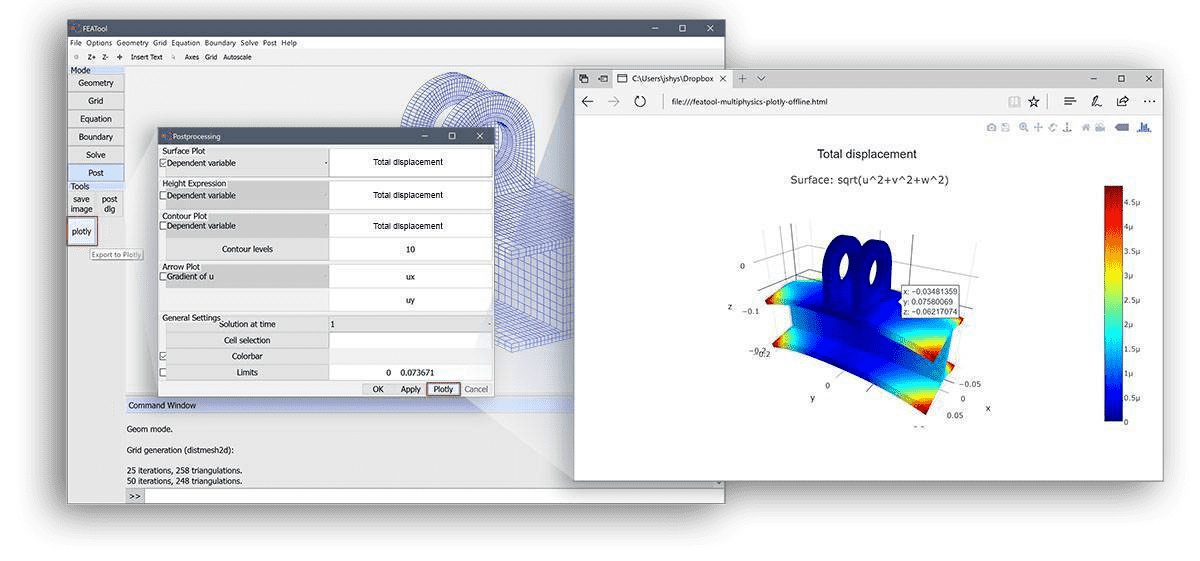
Interactive Web Visualization and Postprocessing with Plotly
Interactive Web Visualization and Postprocessing with Plotly
The Plotly javascript plotting and visualization library is now fully integrated with FEATool Multiphysics and can be used to visualize FEM simulation results and data. In comparison with the built-in MATLAB graphics, plotly plots feature the following advantages fully self-contained and interactive web graphics pages …
Advanced Command Line Postprocessing and Visualization
Advanced Command Line Postprocessing and Visualization

The following post breaks down and explains the postprocessing and visualization steps used to create the images and video for the axisymmetric stress-strain brake disk analysis model. By using the Octave or MATLAB command line and exported finite element fea data struct one can create custom graphics and …